Wang Haihua
🍈 🍉🍊 🍋 🍌
正态分布(Normal distribution),也称“常态分布”,又名高斯分布(Gaussian distribution),最早由A.棣莫弗在求二项分布的渐近公式中得到。C.F.高斯在研究测量误差时从另一个角度导出了它。P.S.拉普拉斯和高斯研究了它的性质。是一个在数学、物理及工程等领域都非常重要的概率分布,在统计学的许多方面有着重大的影响力。 正态曲线呈钟型,两头低,中间高,左右对称因其曲线呈钟形,因此人们又经常称之为钟形曲线。
正态分布的概率密度函数为 $$ f(x)=\frac{1}{\sqrt{2 \pi} \sigma} \exp \left(-\frac{(x-\mu)^{2}}{2 \sigma^{2}}\right) $$
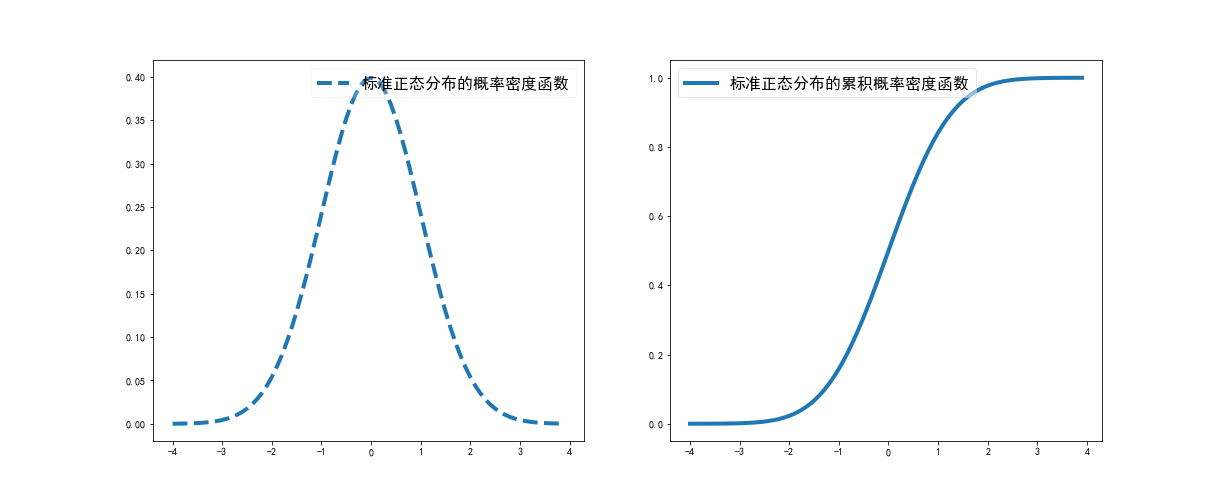
标准正态分布取期望μ=0,标准差σ=1 $$ f(x)=\frac{1}{\sqrt{2 \pi}} \exp \left(-\frac{x^{2}}{2}\right) $$
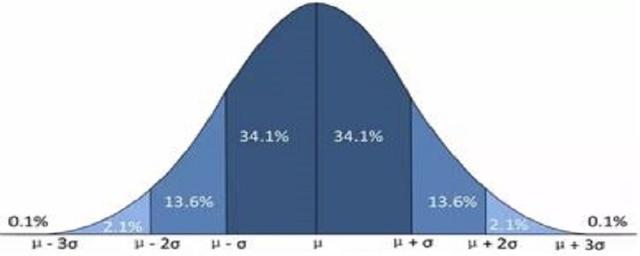
正态分布的3σ原则为:数值分布在(μ-σ,μ+σ)中的概率为0.6827;数值分布在(μ-2σ,μ+2σ)中的概率为0.9545;数值分布在(μ-3σ,μ+3σ)中的概率为0.9973,可以认为,Y的取值几乎全部集中在(μ-3σ,μ+3σ)区间内,超出这个范围的可能性仅占不到0.3%。
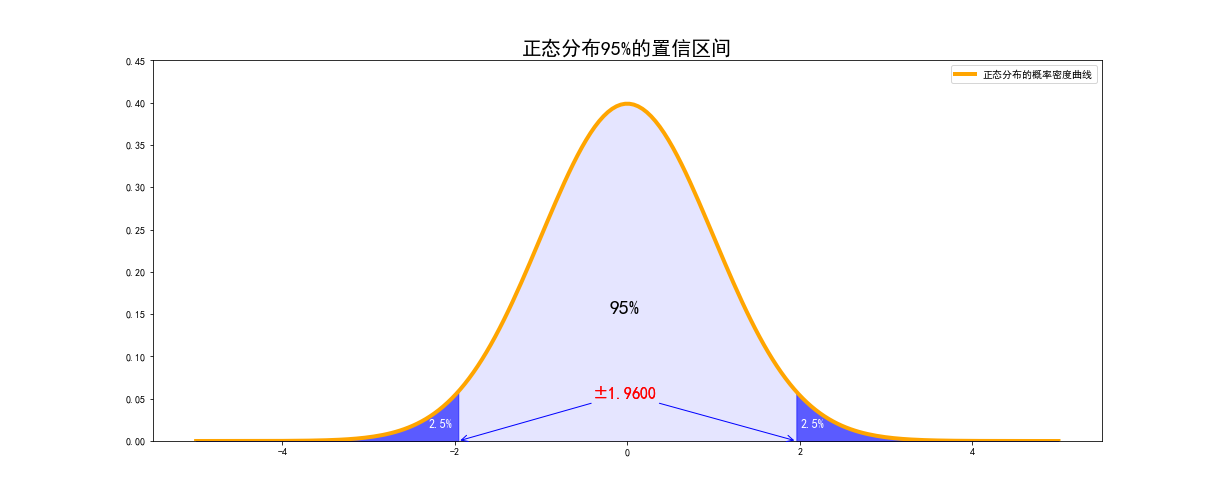
在统计中常用到的正态分布置信区间的概念其实就是根据概率值反向计算对应的随机变量所在的范围,如计算标准正态分布95%的置信区间,就是寻找平均值前后1.96个标准差所在的区间
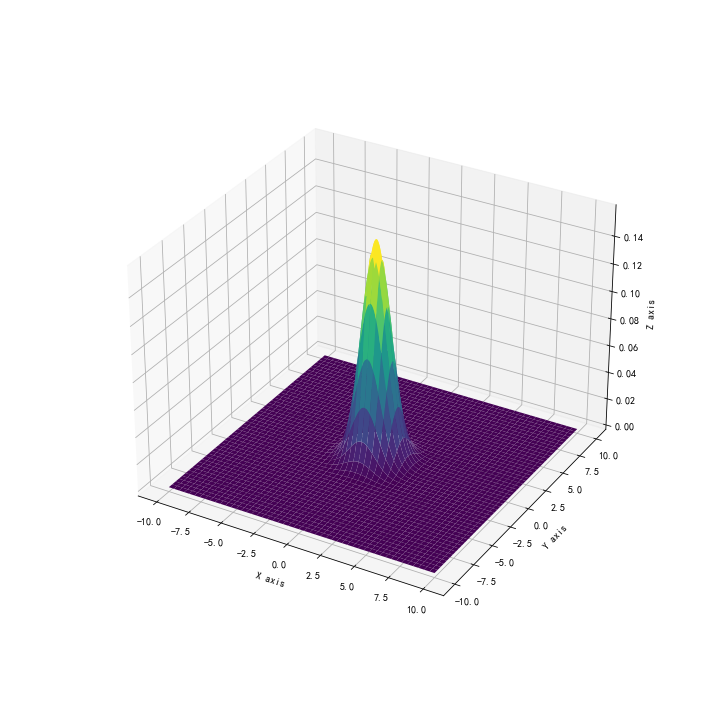
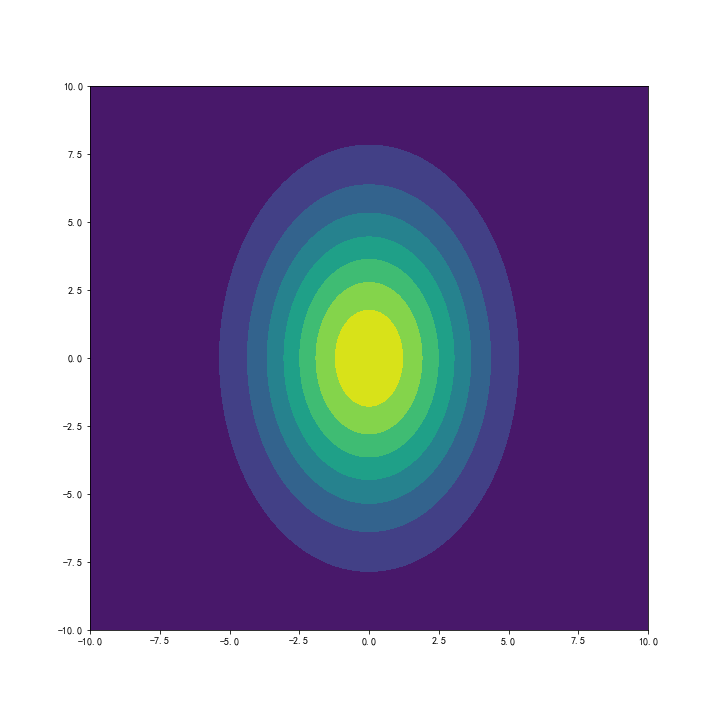
多元正态分布的概率密度函数为 \begin{equation} f_\boldsymbol{X}(x_1,...,x_2)=\frac{1}{\sqrt{(2\pi)^k|\Sigma|}}\exp{\Big(-\frac{(x-\mu)^T\Sigma^{-1}(x-\mu)}{2}\Big)} \end{equation} 其中$\Sigma$为多元正态分布的协方差矩阵,$|\Sigma|$为协方差矩阵的行列式,$\Sigma^{-1}$为协方差矩阵的逆矩阵。
下图展示的是一个二元正态分布的立体图像
还可以通过等高线图展示其平面图像
参考文献
import numpy as np
import matplotlib.pyplot as plt
plt.rcParams['font.family']=['SimHei']
plt.rcParams['axes.unicode_minus'] = False
%matplotlib inline
import scipy as sp
import scipy.stats
import math
1.1
def normal(x,mu,sigma):
return (1/(math.sqrt(2*math.pi)*sigma))*math.e**(-(x-mu)**2/sigma**2)
mu=0
sigma = 1
t_list = np.linspace(-4,4)
ft = [normal(i,0,1) for i in t_list]
plt.plot(t_list, ft,linewidth = 2)
plt.xlabel(r'$x$',fontsize = 15)
plt.ylabel(r'$f(x)$',fontsize = 15)
plt.grid()
plt.savefig('images/02norm0.png')
mu = 0
sigma = 1
x = np.arange(-4, 4, 0.1)
norm_pdf = sp.stats.norm.pdf(x, mu, sigma)
norm_cdf = sp.stats.norm.cdf(x, mu, sigma)
fig, ax = plt.subplots(nrows = 1, ncols = 2, figsize = (17, 7))
ax[0].plot(x,norm_pdf, lw = 4, label = '标准正态分布的概率密度函数', ls = '--')
ax[0].legend(fontsize = 16, loc = 'upper right', framealpha=0.2)
ax[1].plot(x,norm_cdf, lw = 4, label = '标准正态分布的累积概率密度函数')
ax[1].legend(fontsize = 16,fancybox=True, framealpha=0.5)
plt.savefig('images/02norm1.png')
plt.show()
norm_95_r = sp.stats.norm.ppf(.975) # ppf mean point percentage function, actually inverse CDF
norm_95_l = sp.stats.norm.ppf(.025)
x = np.linspace(-5, 5, 200)
y = sp.stats.norm.pdf(x)
xl = np.linspace(-5, norm_95_l, 100)
yl = sp.stats.norm.pdf(xl)
xr = np.linspace(norm_95_r, 5, 100)
yr = sp.stats.norm.pdf(xr)
fig, ax = plt.subplots(figsize = (17, 7))
ax.plot(x,y, lw = 4, label = '正态分布的概率密度曲线', ls = '-', color = 'orange')
ax.set_ylim([0, .45])
ax.fill_between(x, y, 0, alpha=0.1, color = 'blue')
ax.fill_between(xl,yl, 0, alpha=0.6, color = 'blue')
ax.fill_between(xr,yr, 0, alpha=0.6, color = 'blue')
ax.text(-.2, 0.15, '95%', fontsize = 20)
ax.text(-2.3, 0.015, '2.5%', fontsize = 12, color = 'white')
ax.text(2.01, 0.015, '2.5%', fontsize = 12, color = 'white')
ax.annotate('±%.4f' %norm_95_r, xy = (norm_95_r, 0), xytext = (-.4, .05), weight = 'bold', color = 'r',
arrowprops = dict(arrowstyle = '->', connectionstyle = 'arc3', color = 'b'), fontsize = 16)
ax.annotate('±%.4f' %norm_95_r, xy = (norm_95_l, 0), xytext = (-.4, .05), weight = 'bold', color = 'r',
arrowprops = dict(arrowstyle = '->', connectionstyle = 'arc3', color = 'b'), fontsize = 16)
ax.set_title('正态分布95%的置信区间', size = 20)
plt.legend()
plt.savefig('images/02norm3.png')
2
%matplotlib inline
mu_x = 0
sigma_x = 1
mu_y = 0
sigma_y = 1
#Create grid and multivariate normal
x = np.linspace(-10,10,500)
y = np.linspace(-10,10,500)
X, Y = np.meshgrid(x,y)
pos = np.empty(X.shape + (2,))
pos[:, :, 0] = X; pos[:, :, 1] = Y # more technical than next one
norm = sp.stats.multivariate_normal([mu_x, mu_y], [[sigma_x, 0], [0, sigma_y]]) # frozen
#Make a 3D plot
fig = plt.figure(figsize = (10, 10))
ax = fig.gca(projection='3d')
ax.plot_surface(X, Y, norm.pdf(pos),cmap='viridis',linewidth=0)
ax.set_xlabel('X axis')
ax.set_ylabel('Y axis')
ax.set_zlabel('Z axis')
plt.savefig('images/02norm4.png')
#Parameters to set
mu_x = 0
sigma_x = 7
mu_y = 0
sigma_y = 15
x = np.linspace(-10,10,500)
y = np.linspace(-10,10,500)
X,Y = np.meshgrid(x,y)
pos = np.array([X.flatten(),Y.flatten()]).T # more intuitive than last one
rv = sp.stats.multivariate_normal([mu_x, mu_y], [[sigma_x, 0], [0, sigma_y]])
fig = plt.figure(figsize=(10,10))
ax0 = fig.add_subplot(111)
ax0.contourf(X, Y, rv.pdf(pos).reshape(500,500),cmap='viridis')
plt.savefig('images/02norm5.png')